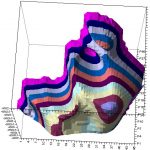
This is a post about my graduation thesis at the University.
For now it seems simple and maybe not quite appropriate for such specialty as a physicist, but every measurement needs a scale.
For an average student at those times and place it was a decent work and also these results were actually demanded by the faculty (at least I was told so).
Actually, this theme has been offered to me by the faculty executives because I’d often been seen at the IT class playing Starcraft and apparently loved computers 🙂
Succession is also has significant influence on the level of the work. We were, if I’m not mistaken, the third graduation of this specialty (and the first, which would have a final exam in addition to graduation thesis) and before us there were only some attempts to run Dalton for ab-initio calculations.
Dalton, as I remember, at least at those times performed only ab-initio calculations, which were painful because typical faculty’s PC had CPU frequency about 1GHz, ~256MB RAM and slow IDE hard drive. Also we hadn’t any clusters or supercomputers at the university 🙂
Furthermore, even now Linux has “a human face” only for androids, but at those times (~2003) it was much much worse, so it wasn’t a task for an average scientist – to install Linux and to build Dalton there.
Situation at those moment required the ability to do calculations of molecular potential energy in configurational space (Potential Energy Surface, PES). It generally was a two-dimensional space of two angles (flat or torsion) or bond lengths.
Also we were needed to do some comparison, that can prove for some extent the usage of semi-empirical methods for calculations. Because it was impossible to use ab-initio with our resources even for a simplest systems.
We understood that such comparison is limited at least to particular type of molecules and doesn’t indulge us to do any calculation in semi-empiric, but anyway…
For my work I had to use Hypercube’s Hyperchem. This program wasn’t free but in “the land of free Photoshop”… You know…
Essentially, my work consisted of a few scripts on Visual Basic for Applications which read molecule’s transformation limits from the user input, sent commands to Hyperchem in order to do transformations and calculations and read results from Hyperchem. Those scripts ran inside Microsoft Excel and gathered data into a matrix inside Excel Spreadsheet so later they could be analyzed using Excel’s tools.
There were no any hacking stuff in what I have done. Remote control from an external application using DDE is described in the Hyperchem’s documentation.
I used Hyperchem 7.03. Actually, there was an embedded function that allowed to plot Potential Energy Surfaces, but it didn’t work correctly.
Interestingly enough, 10 years later I also was forced to write my own software for home bookkeeping because of the buggy graphs in the original application.
I used Microsoft Excel from Microsoft Office 97 or Microsoft Office XP (2002) suite.
Operation System was W2K.
As I mentioned above, Hyperchem had it’s own utility for plotting molecular PES, but it had some shortcomings which made it useless:
– there was no data matrix for ab-initio and semi-empirical methods
– even if there was a matrix (molecular mechanics) it was impossible to find the energy value of the particular molecular conformation because matrix didn’t have conformational data.
Such data was on graphs, but there were no precise energy values there.
– Zooming for PES graph required a recalculation for entire PES because of the new “cut off”
– There was a limit for molecular energy magnitude in this utility (100000 Kcal/mol), whereas in my calculations typical values were about 800000.
– There were some bugs in the interface and data processing.
All complains listed above is about Hyperchem version 7.03 and maybe they have already been fixed in recent versions.
Concept of the PES is fundamental for Hyperchem, because one of the main goals of such a product is a search for the optimal (lowest energy) conformation of a molecule.
This search is based on analyzing molecular PES in 3N-dimensional space, where N is a number of degrees of freedom.
Hyperchem is capable to perform 3 types of PES calculations
– geometry optimization
– single point
– molecular dynamics
In my work I used first two of them. Geometry optimization was used to achieve some plausible initial geometry for molecule.
“Single point” is a calculation of one point on the PES which results molecular energy and gradient at that point.
All used macros have the same structure:
– Connecting to Hyperchem from Excel
– Requesting parameters from user
– Cycle:
— One step of molecular transformation according to user’s data
— single point calculation
— retrieving data from Hyperchem to Excel
– Further analysis using Excel toolkit
Here is the picture of the dialog window of my first macro. It allows to create two-dimensional PES (two variables and resulting energy).
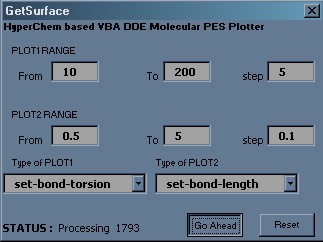
Macro is written on VBA and is designed for RC references style and a dot as a separator between integer and fractional parts of the number.
Bond lengths (two adjacent atoms selected), flat angles (three adjacent atoms selected), torsion angles (four adjacent atoms) can be used as a variables.
Typical usage of the macro:
1) Run Hyperchem and create desired molecular structure there
2) Select a method of computation (semi-empiric or ab initio).
3) Optimize geometry if needed
4) Select the first variable and name it (Select – Name Selection) as Plot1. Select the second variable and name it as Plot2.
5) Open Excel file, containing macro GetSurface, run the macro (Ctrl+Q).
6) In the dialog window you should describe both selected variables – type, start value, end value and the step.
7) Calculation process is started after the button GoAhead is pressed. The remaining amount of ‘single point’ requests is shown at the bottom of the dialog window.
8) The matrix of energy values and conformational coordinates are being created inside Excel worksheet during the process of calculations.
9) When the work is done the word “Waiting” can be seen at the bottom of the dialog window. You may close the dialog window after that. For further analysis you should use Excel’s diagram tools.
A few notes about steps 3 and 4:
– If the geometry of your molecule is not pre-optimized (for example you just have drawn it by hand) you should do some geometry optimization before you can proceed to the PES plotting.
It obvious, but anyway…
– The sequence of atoms selection does matter.
For a flat angle the moving part will be the part which you selected first.
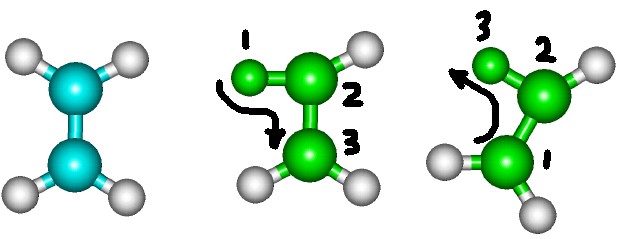
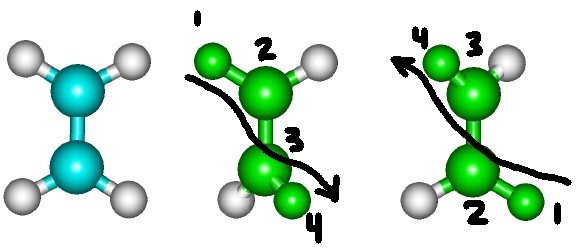
For a torsion angles the last selected part will be the moving part.
However, there is at least one flaw in GetSurface macro and the method by which angles are changed in Hyperchem.
Consider C2H4 molecule for which we want to plot a PES with reference to two flat HCH angles. It seems natural that HCH angle should be symmetrical with respect to C=C bond. At least it is more desirable to see a PES in the space of two HCH angles which have been changing symmetrically with respect to C=C.

But if you look at the pictures, which describe how Hyperchem changes flat angles, you’ll see that it will change the position of one HC bond only. It leads to unacceptable molecule’s conformation.
The only way I have found to do such symmetrical transformations was to increase the number of controlled parameters in macro and allow to describe each HCH angle as two HCC angles.
These changes had been committed in the GetSurface+ macro.
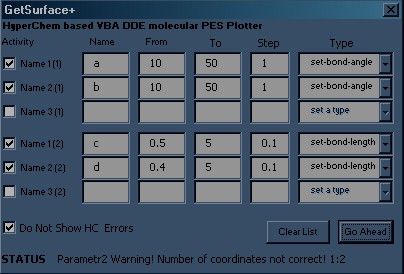
For the fastest computing you should decrease expenses for rendering.
I have found only two options available for that matter.
First – you should use simplest type of molecule’s image – Sticks.
Second – in the macro you should periodically call do-qm-isosurface(no) because Hyperchem switches this parameter on after each single point computation. This leads to unsolicited calculation of Electrostatic Potential Surface and slows down the work.
I’m curious what it feels like to do these computations now, on a modern hardware.
In the year of 2003 I had been doing calculations on Pentium-2 450MHz 128MB RAM. At least for ab initio computations I did software RAID0 from two UDMA33 hard drives.
That was a cool time and I was happy 🙂
Anyway, here is the listing of the GetSurface macro which was used for most of calculations.
If you are interested, GetSurface+ can be found among the attachments at the bottom of this post.
VBA script
'open dialog window Sub GetSurface() UserForm2.Show End Sub 'Reset button handler Private Sub CommandButton4_Click() ' cleaning 50x50 cells area For k = 0 To 50 For l = 0 To 50 dr$ = Str(50 - k) Label15.Caption = "Clearing " + dr$ ActiveCell.Offset(rowOffset:=k, columnOffset:=l).Value = "" Application.DDEExecute Channel, "[select-none]" Next l Next k Label15.Caption = "Waiting" End Sub 'initializing elements of the dialog window Private Sub UserForm_Initialize() Channel = Application.DDEInitiate("HyperChem", "System") Application.DDEExecute Channel, "[query-response-has-tag(no)]" Application.DDEExecute Channel, "[hide-errors(yes)]" Application.DDEExecute Channel, "[do-qm-isosurface(no)]" ComboBox1.AddItem "set-bond-angle" ComboBox1.List(0, 1) = "set-bond-angle" ComboBox1.AddItem "set-bond-torsion" ComboBox1.List(0, 2) = "set-bond-torsion" ComboBox1.AddItem "set-bond-length" ComboBox1.List(0, 3) = "set-bond-length" ComboBox2.AddItem "set-bond-angle" ComboBox2.List(0, 1) = "set-bond-angle" ComboBox2.AddItem "set-bond-torsion" ComboBox2.List(0, 2) = "set-bond-torsion" ComboBox2.AddItem "set-bond-length" ComboBox2.List(0, 3) = "set-bond-length" Application.DDEExecute Channel, "[select-none]" Label15.Caption = "Waiting" TextBox5.Value = 1 TextBox8.Value = 1 CommandButton2.Value = True End Sub 'GoAhead button handler Private Sub CommandButton2_Click() 'reading user's input and creating grid. set1$ = ComboBox1.Value set2$ = ComboBox2.Value vf1 = Val(TextBox2.Value) vt1 = Val(TextBox3.Value) vs1 = Val(TextBox5.Value) vf2 = Val(TextBox6.Value) vt2 = Val(TextBox7.Value) vs2 = Val(TextBox8.Value) col1 = ((vt1 - vf1) / vs1) + 1 col2 = ((vt2 - vf2) / vs2) + 1 value1 = vf1 For i = 1 To col1 Label15.Caption = "Marking" ActiveCell.Offset(rowOffset:=0, columnOffset:=i).Value = value1 value1 = value1 + vs1 Next i Label15.Caption = "Waiting" Value2 = vf2 For j = 1 To col2 Label15.Caption = "Marking" ActiveCell.Offset(rowOffset:=j, columnOffset:=0).Value = Value2 Value2 = Value2 + vs2 Next j If (col1 <> 1 And col2 <> 1) Then res = col1 * col2 ' end of the grid creation ' main cycle begins For n = 1 To col2 v2 = vf2 + (vs2 * n) 'clear all selection Application.DDEExecute Channel, "[select-none]" 'Select Plot2 Application.DDEExecute Channel, "[select-name(PLOT2)]" 'setup Plot2 Application.DDEExecute Channel, "[" & set2 & "(" & v2 & ")]" 'clear all selection Application.DDEExecute Channel, "[select-none]" 'change Plot1 For m = 1 To col1 v1 = vf1 + (vs1 * m) xp$ = Str(Fix(res - 1)) dr = res - 1 Label15.Caption = "Processing " + xp$ Application.DDEExecute Channel, "[select-none]" Application.DDEExecute Channel, "[select-name(PLOT1)]" Application.DDEExecute Channel, "[" & set1 & "(" & v1 & ")]" Application.DDEExecute Channel, "[select-none]" 'draw steps remaining Label15.Caption = "Processing " + xp$ 'do single plot Application.DDEExecute Channel, "[do-single-point]" 'read resulting total-energy result = Application.DDERequest(Channel, "total-energy") ActiveCell.Offset(rowOffset:=n, columnOffset:=m).Value = result res = dr Next m Next n End If Label15.Caption = "Waiting" End Sub |
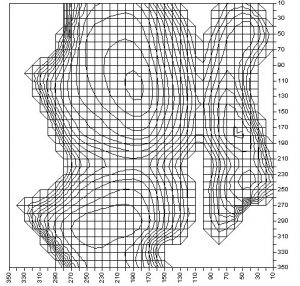
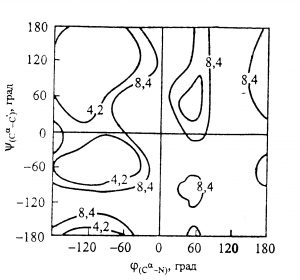
At first we’ve compared our results to well-known data from a literature. Actually we’ve been able to find only one sample of such data for N-Acetyl-L-alanine methylamide (A.B. Rubin Biophysics vol.1 (of 2 volumes), Theoretical biophysics [ ISBN 5-211-06110-1, 5-211-06109-8, 5-02-033598-3, 5-02-033597-5]).
We’ve decided that this is a good qualitative conformity.
 methylamide Hyperchem PES |
 methylamide reference PES |
We had no any data to do a quantitative comparison.
The second task was to do a comparison between ab-initio and semi-empiric calculations of PES for the type of molecules in which faculty was interested.
We used 2-Vinylcarbazole as a reference type.
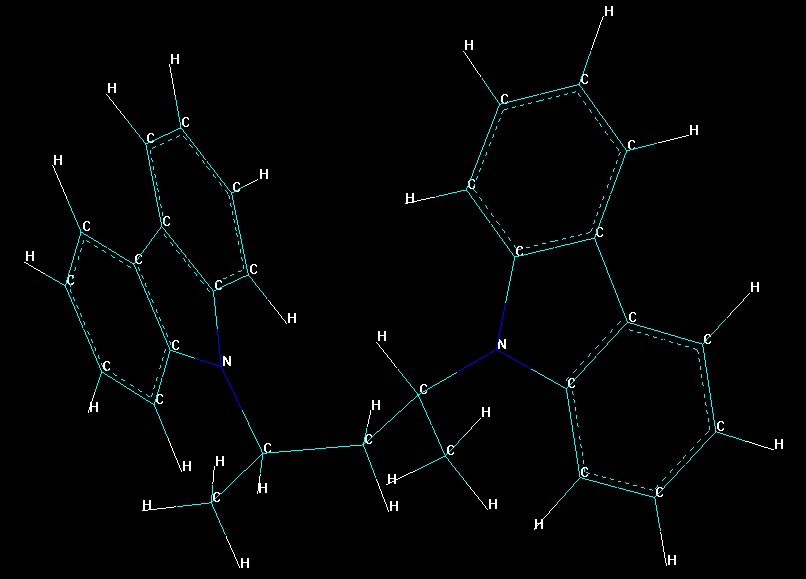
I hope this ugly image gives you a little hint on what 2-vinylcarbazole is
We’ve built PES for 2-Vinylcarbazole using semi-empiric PM3 method (in the space of 2 torsion angles):
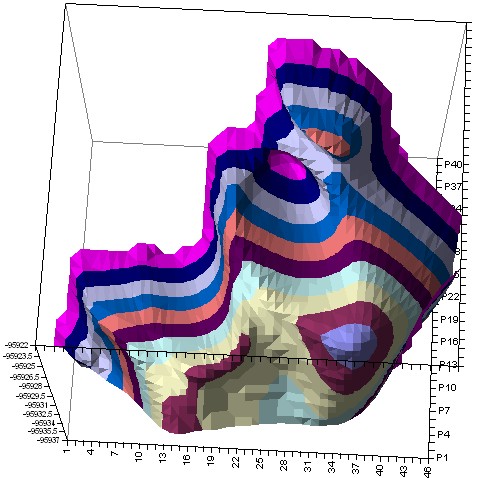
2-Vinylcarbazole Hyperchem PES
Then we selected a part of the surface, containing one global and two local minimums.
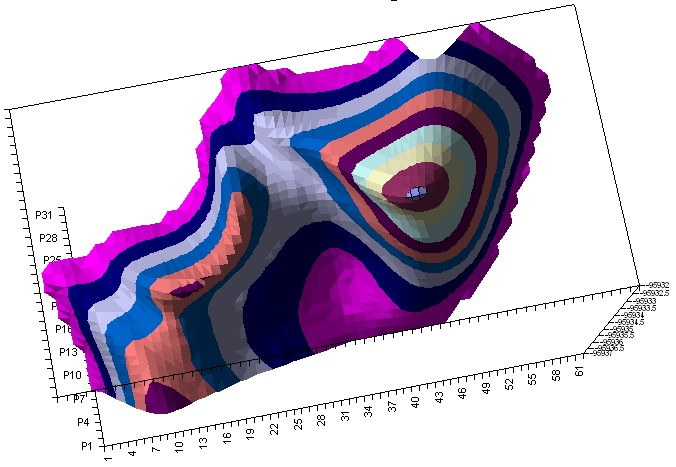
2-Vinylcarbazole Hyperchem PES
We performed about 10 ab-initio calculations for slices of this surface. We selected slices in a such way that they would show a particular, recognizable relief changes so we could compare ab-initio and semi-empiric. We moved the “cutting edge” from about P16 point to P28 so we should see during this movement the diminishing of the local minimum and increasing of the global minimum.
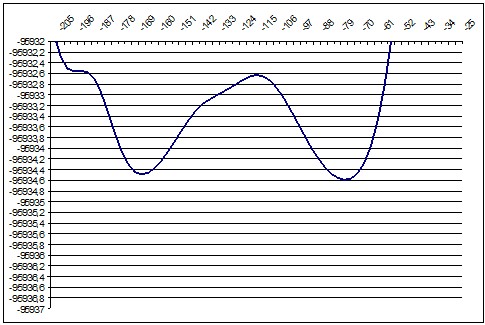 PM3 136deg |
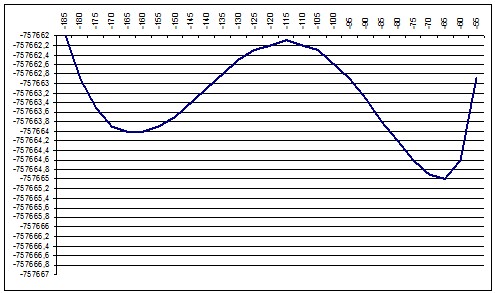 ab initio 130deg |
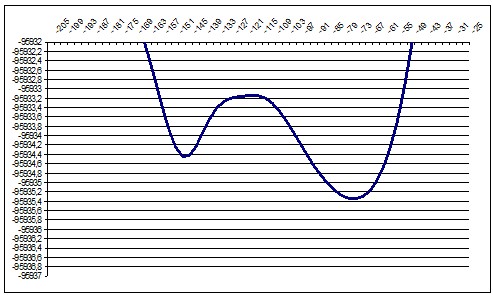 PM3 140deg |
|
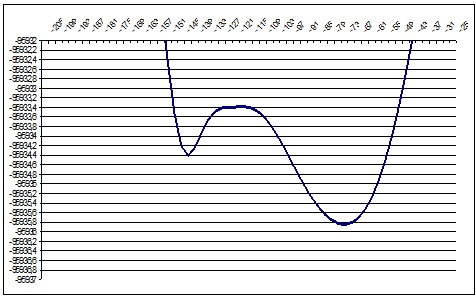 PM3 157deg |
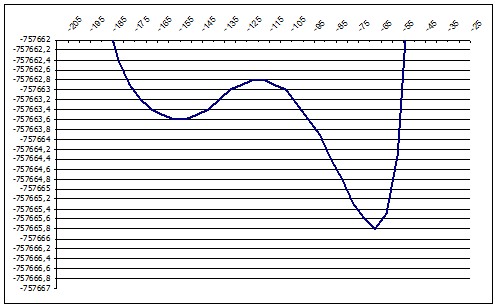 ab initio 136deg |
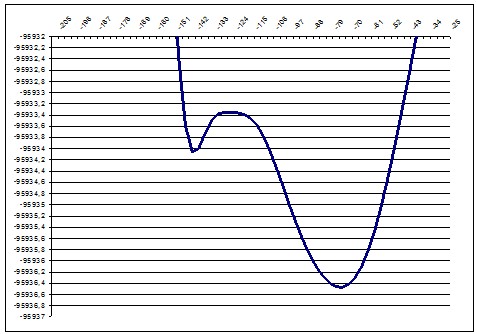 PM3 166deg |
|
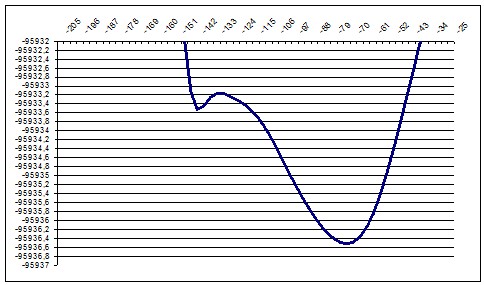 PM3 172deg |
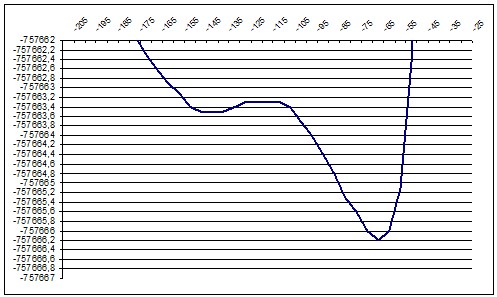 ab initio 140deg |
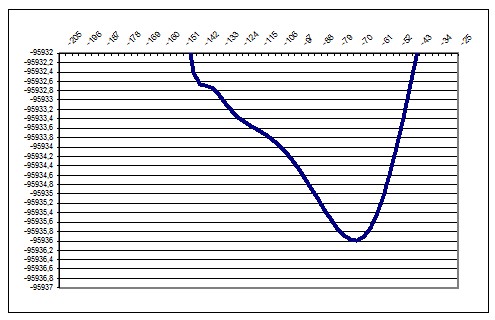 PM3 178deg |
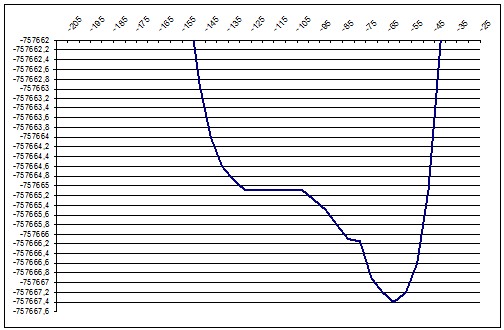 ab initio 157deg |
We’ve decided that this is a good qualitative and quantitative conformity so we could use semi-empiric methods in our tasks.
After that we’ve performed a few calculations of Potential Energy Surfaces in a space of two torsion angles for dipeptides from the list of amino acid residues: phe, trp, tyr, his.
Some of the images can be seen below.
PES images
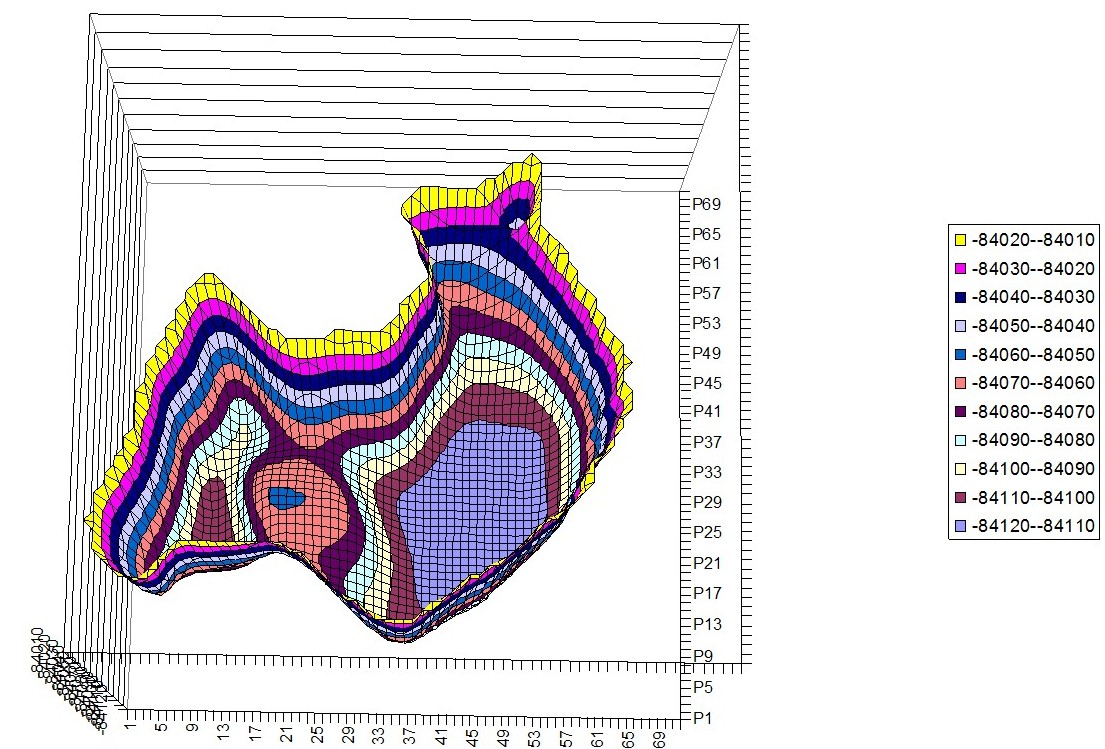
Phenylalanine – Histidine Hyperchem PES
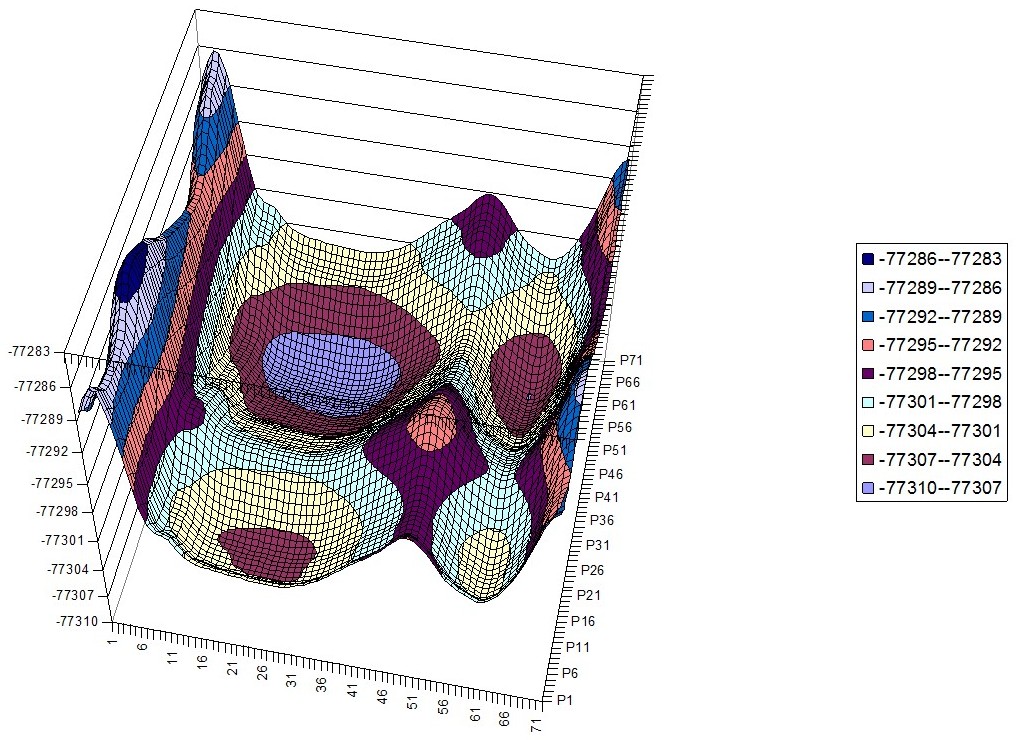
Phenylalanine – Phenylalanine Hyperchem PES
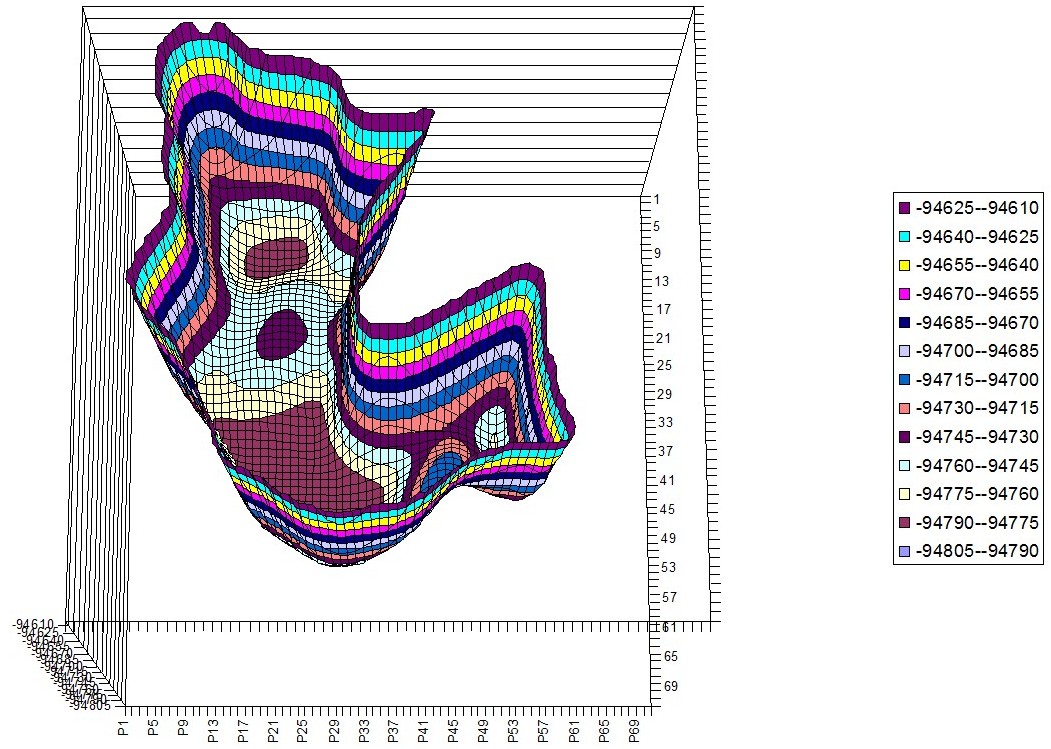
Phenylalanine – Tryptophan Hyperchem PES
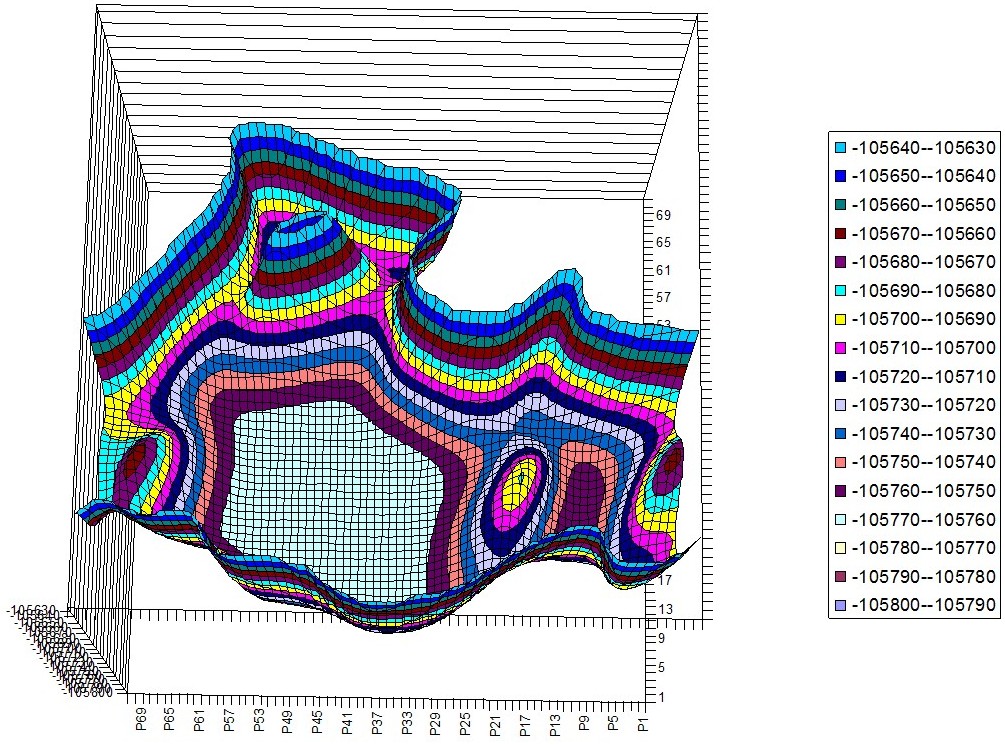
Tryptophan -Tryptophan Hyperchem PES
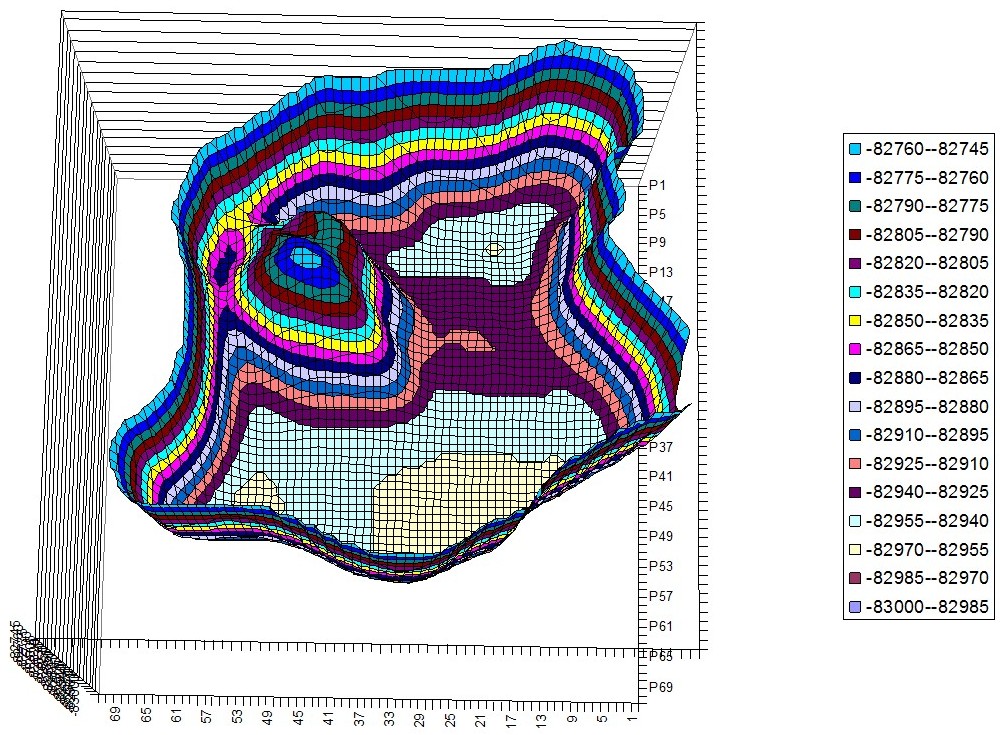
Tyrosine – Histidine Hyperchem PES
Next we’ve considered some artificial chemical compounds similar to N-Vinylcarbazole but with a different molecule as a monomer. As a monomer we’ve used (in order of increasing mass value ) NH2, NO, C2H4, naphthalene, phthalimide, carbazole.
We’ve calculated PES for those molecules (two monomers in a space of two torsion angles) and revealed PES symmetry deterioration along with increasing mass of the monomer.
PES images
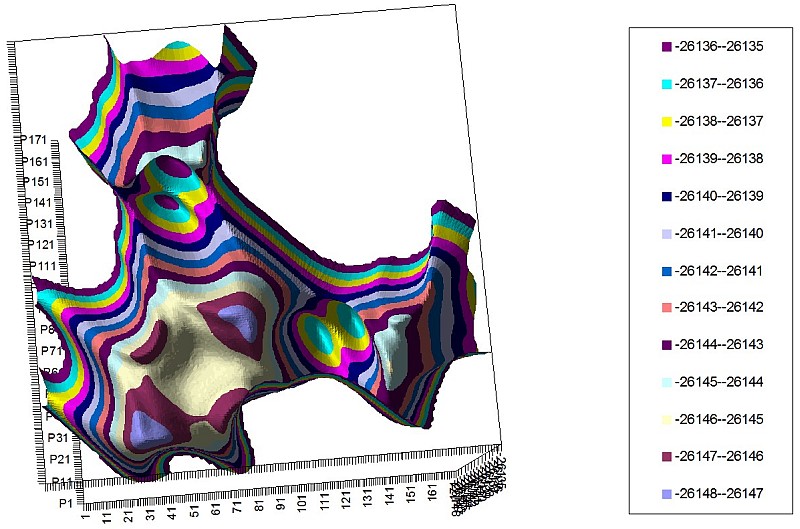
2-NH2 PES of 2 torsion angles
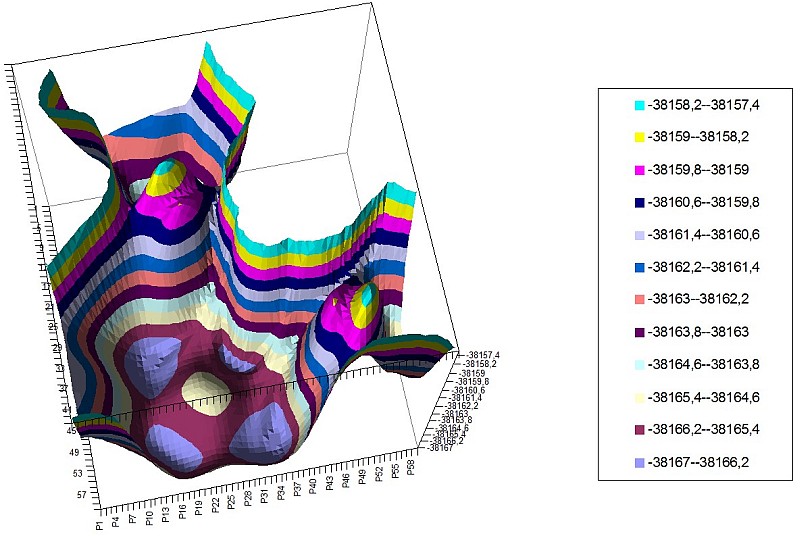
2-NO PES of 2 torsion angles
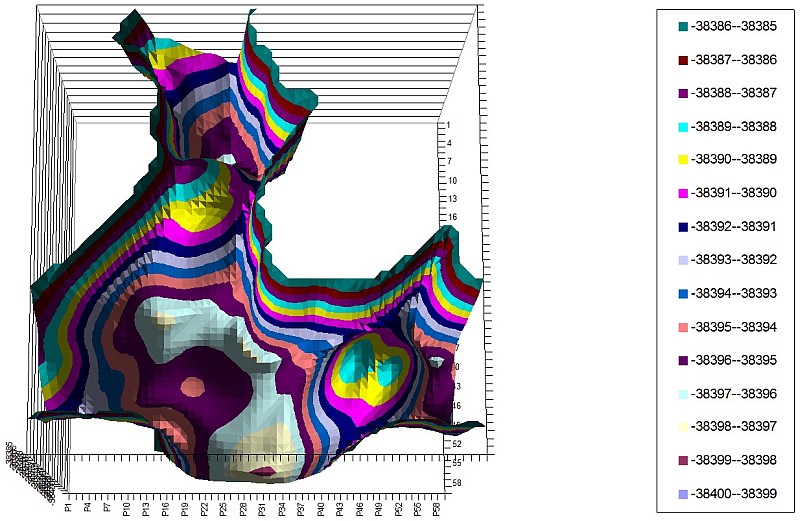
2-C2H4 PES of 2 torsion angles
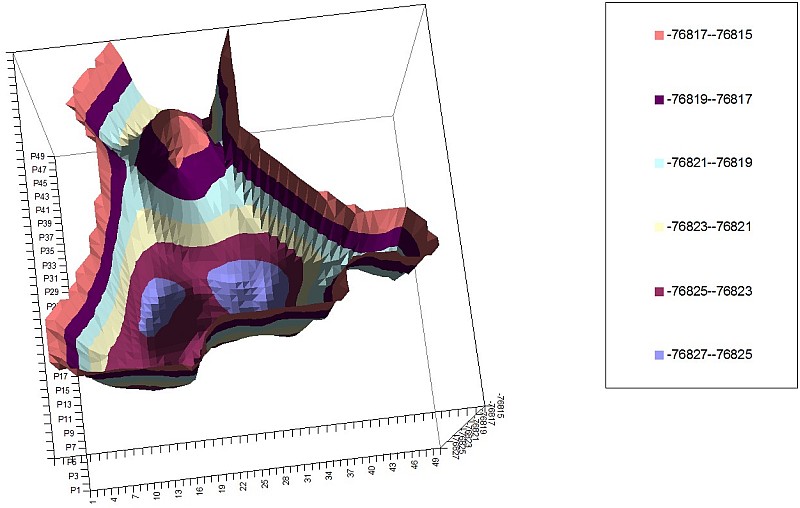
2-Naphthalene PES of 2 torsion angles
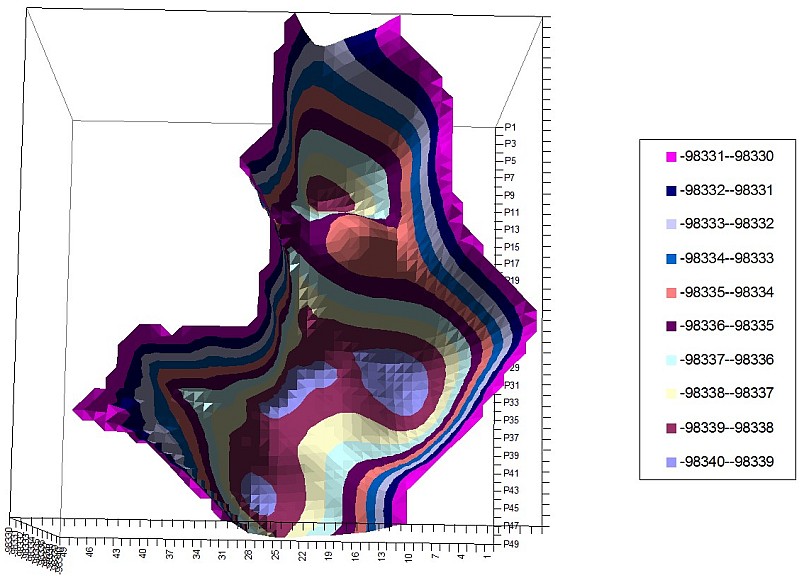
2-Phthalimide PES of 2 torsion angles
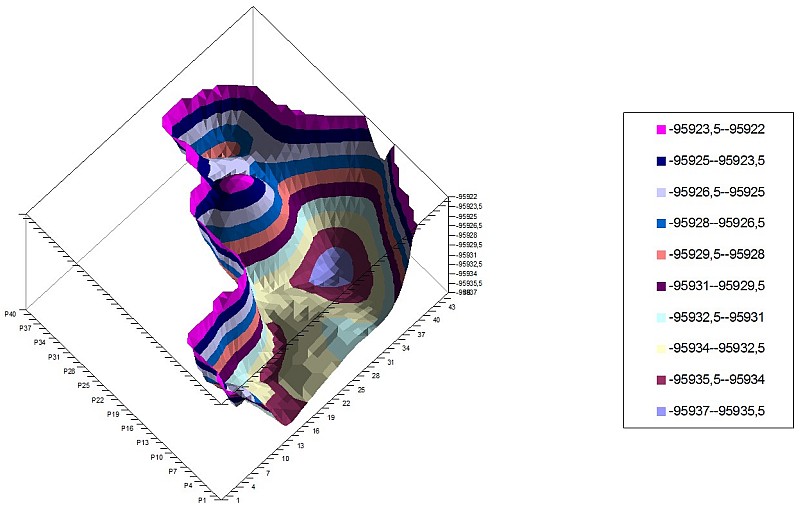
2-carbazole PES of 2 torsion angles
We also have explored Hyperchem’s capabilities in the field of computing intermolecular interaction (Van der Waals forces).
Hyperchem itself does not contain any utility to perform automatic calculations of intermolecular interaction for given sequence of molecular configurations.
Furthermore, it is impossible to read a magnitude of such small force through the DDE channel.
And even worse, interacting molecules must be aligned along the Hyperchem’s internal axis for predictable transitions. These axis are invisible and this positioning can’t be saved in a file (*.skc).
Eventually a VBA macro was created which usage is somewhat complicated, but it allows to perform many types of automatic calculations for intermolecular interaction.
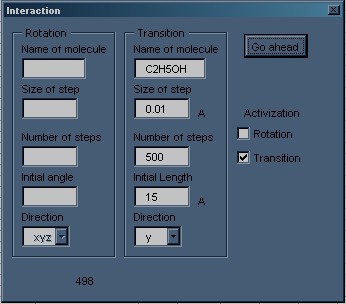
Hyperchem Intermolecular interaction macro dialog
Typical usage sequence:
1) You have to prepare two *.skc files (one molecule per each), containing pre-optimized molecules, interaction between which you are intended to study.
2) Open one file from step (1) in Hyperchem and merge it with the other.
3) You have to find some way to place both molecules along the same coordinate axis. I did this by creating a named selection of the molecule (Select – Name selection) and using Translation then (Edit – Translate – Translate Selection – Other). It had been helping me to understand where the axis is and to place molecules on one of them.
4) Spreadsheet Interaction_Pascal_Log_Based.xls should be opened and macro is run (Ctrl+Q). In the dialog window you should fill in the name of the molecule that will be translated, initial distance between molecules, step size and direction (same for rotation).
5) After the button “GoAhead” is clicked the process starts and at the bottom of dialog window you will see a countdown of steps remained.
Molecular coordinates will be transferred to the spreadsheet via DDE, but energy values will be written to the log file because they can’t be passed through DDE. After the work is done the macro should execute auxiliary executable file in order to reorganize the log file for easier data transfer to Excel spreadsheet by copy-paste. Unfortunately I have no that executable but its task was simple (convert log to the column of numbers that can be coy-pasted to Excel) and can be easily reproduced. It was something like this (Borland Pascal):
Borland Pascal source code
1 2 3 4 5 6 7 8 9 10 11 12 13 14 15 16 17 18 19 20 21 22 23 24 25 26 27 28 29 30 31 | program loganalyse; uses crt; var t1,t2: Text; s: string; count: integer; begin clrscr; assign(t2,'c:/out.txt'); assign(t1,'c:/chem1.log'); reset(t1); rewrite(t2); count:= 0; while not Eof(t1) do begin readln(t1,s); if (s[1] = 'T') and (s[2] = 'o' ) and (s[3] = 't') and (s[16]=' ') and (s[56]='a') then begin s:= copy(s,40,14); writeln(t2,s); count:= count+1; gotoxy(5,5); writeln('processing', count); end; end; close(t1); close(t2); readln; end. |
Here is a few images of intermolecular interaction between Carbazole and O2, Phthalimide and O2 in a different attitudes and different interacting parts of the larger molecule.
Intermolecular interaction
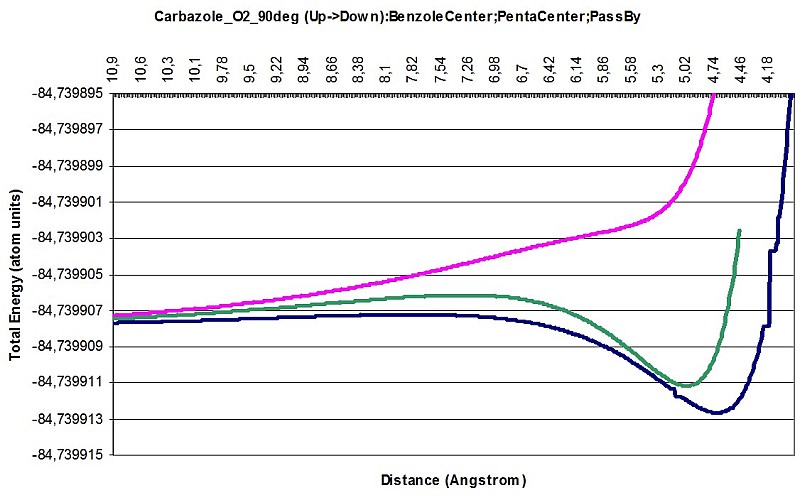
Carbazole O2 interaction 90deg
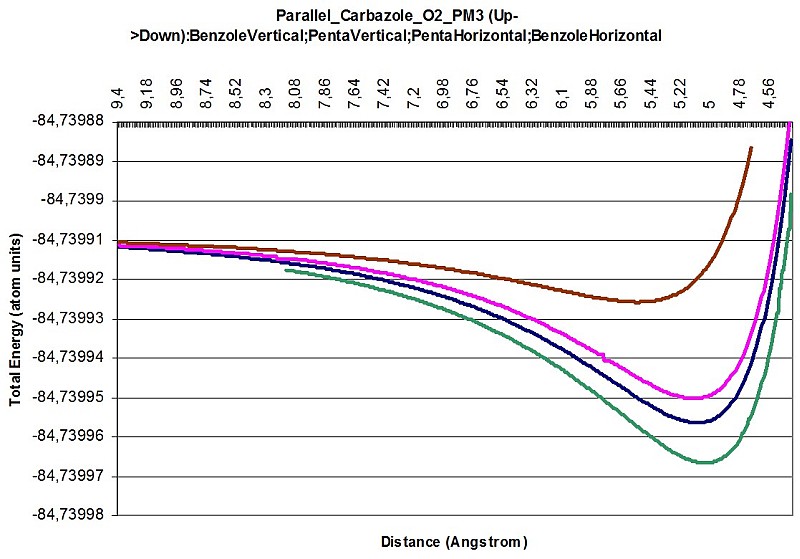
Carbazole O2 interaction parallel
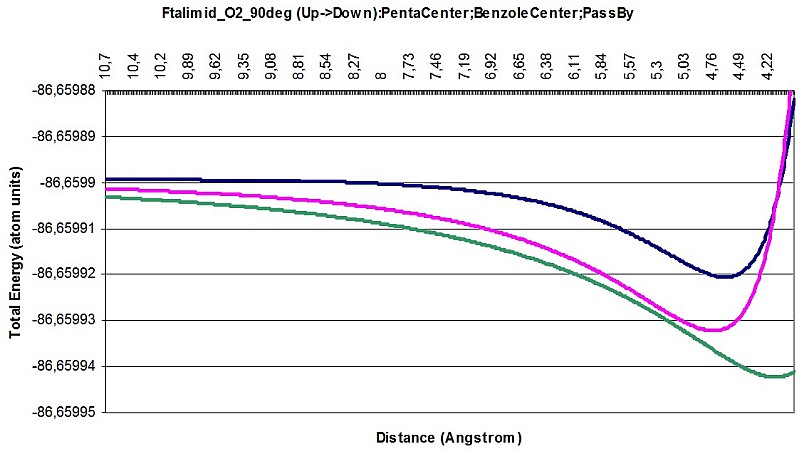
Phthalimide O2 interaction 90deg
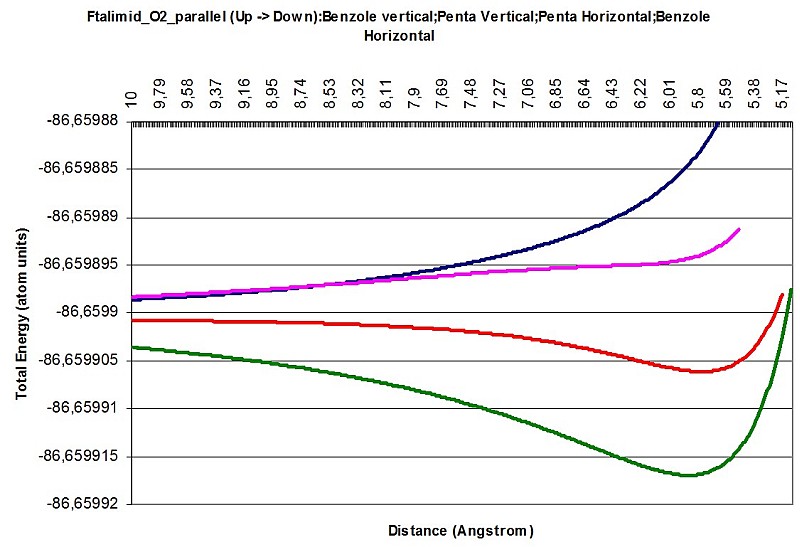
Phthalimide O2 interaction parallel
And at last, source files of macros and other:
GetSurface.xls
GetSurface+.xls
GetSurface+Edited.xls
GetSurfaceEdited.xls
Interaction.xls
InteractionLogBased.xls
Interaction_Pascal_Log_Based.xls
PV(Benzole).xls
PV(NH2).xls
PV(NO).xls
PV[Naftalin].xls
PVC_4.xls
PVF_4.xls
PVN_4.xls
trp_trp.skc
tyr_tyr.skc
tyr-his.skc
his-his.skc
phe_his_MM.skc
phe_phe.skc