
This “project” was started because of my stupidity or at least thoughtlessness. I actually intended to measure output current of my welding inverter and only after a few days of coding it struck me that I want to use a transformer to measure DC. Anyway, significant part of the project had been completed already and I decided to finish it.
Before i began to write this script I tried to find some existing software to configure PZEM and to read its output using personal computer but I couldn’t. All I could find were some kinds of Arduino projects, but I needed to work with PC – to see data on big screen etc.
I saw screenshots on the internet (Aliexpress actually) of some PC software for PZEM v3.0 boards which uses RS485 protocol, but I have only old one.
So, I hope this Autoit script will be helpful for someone 🙂
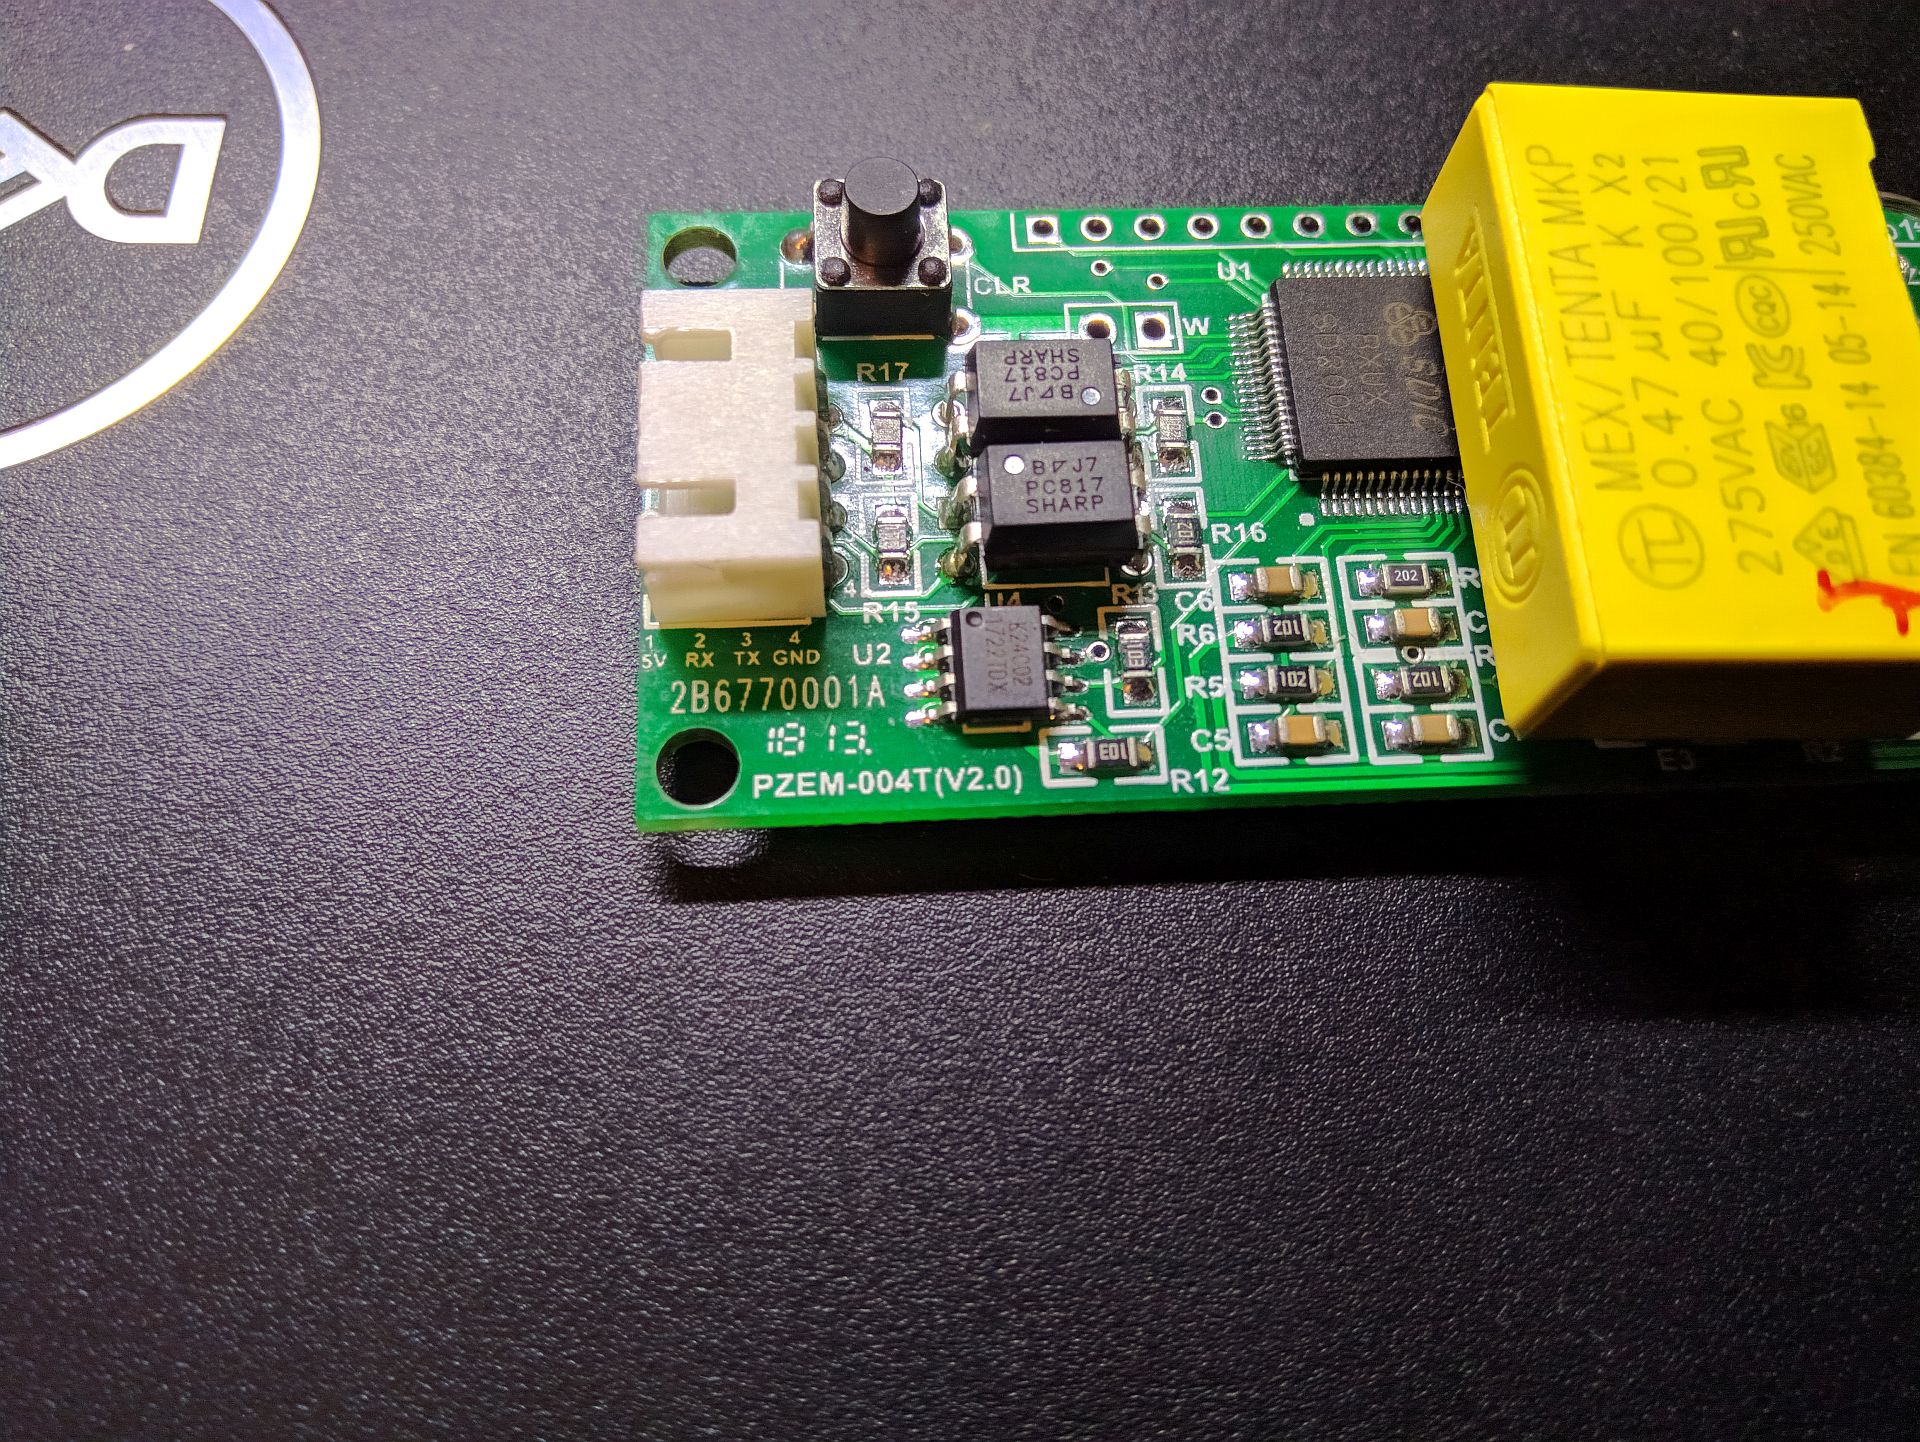
I used USB-RS232 converter to connect PZEM to PC. I believe this converter is made of fake PL2303 chip, but it is irrelevant…
The project is based on two libraries (maybe they call it UDF):
– CommAPI
– GraphGDIPlus
both of them were slightly modified by me so it is necessary to use versions which I provide with my script.
Program’s interface looks like this;
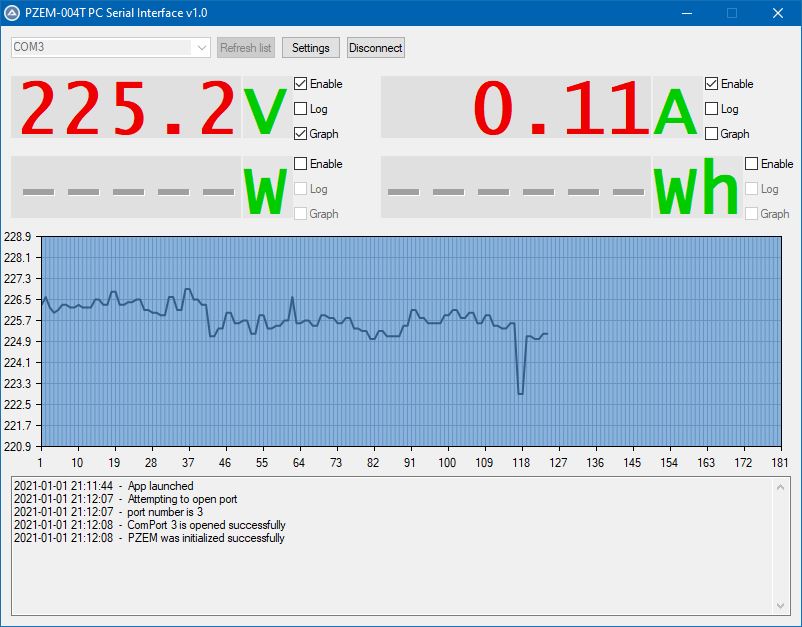
The program has dropdown list (combobox) where user can select COM port which is connected to PZEM.
There are no COM port settings available, because AFAIK the device accepts only one set of connection parameters – so I hardcoded them.
Some delays and timeouts could be adjusted in the menu under “settings” button.
The program has four “displays” to show four parameters that PZEM could supply. Voltage, Current, Power and Energy.
There are checkboxes “Enable” near each of the parameters, so you can read any one of them or all four.
BUT!
Each parameter must be requested separately (AFAIK) and safe timeout between such a request and attempt to read a result is about 500ms. Therefore if you are reading only one parameter it gets updated twice a second. If you have activated two parameters – each of them gets updated once per second. And so on…
Each parameter has “Log” checkbox which enables data logging into the text field at the bottom of the application window.
It logs measurement time and measured value. It also logs the sequential number of measurement ot “tick”, which is used for graphs.
Each parameter has “Graph” checkbox, but only one of them (any one) could be checked at the moment.
If any parameter has “Graph” and “Enable” checkboxes checked then the value of this parameter is plotted on the graph.
Graph is capable of plotting last 180 points of data only.
Graph, obviously, has time on horizontal axis but it is impossible to write actual timestamps on the x-labels – they are too large. So all graphs have “ticks” as labels on X axis. You can enable “Log” to make correlation between ticks and actual time.
Y-axis of graphs have actual data (parameter value) ecxept for Energy, which was too large so only 4 last digits were taken.
Y-axis have range autoadjustment but it wasn’t tested properly.
Though I couldn’t use this script for its initial purpose it helped me anyway.
I used it to put marks (exact power values) on the dimmer which I use to control the temperature of my soldering iron 😀